About
The Pseudomonas aeruginosa database aims to develop a streamlined process of accessing and analyzing Pseudomonas aeruginosa transcriptomes for microbiology research on publicly available data from the National Center for Biotechnology Information (NCBI). The application will contains an extensive transcriptome database that includes read counts for each P. aeruginosa gene (normalized using transcripts per million, or TPM) and sample metadata, allowing users to perform searches, analyze comprehensive datasets, and create visual comparisons in real-time.
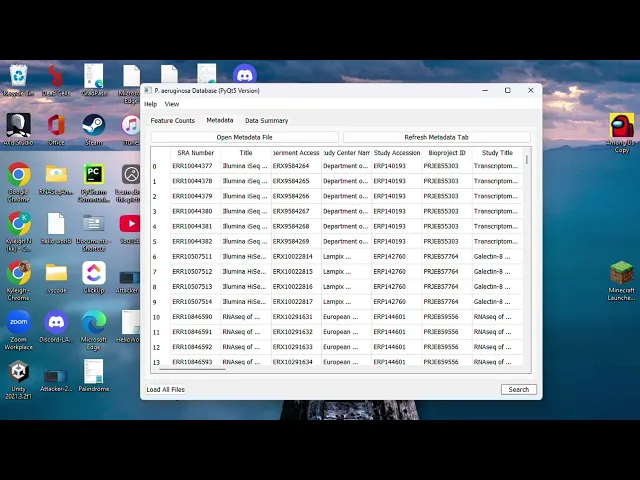
When viewing mapping data, you can use either your own mapped feature counts CSV file or the premade CSVs with all the readily available feature counts. Additional resources connected to CSV formatting and metadata scraping are provided within this page. These files can be opened through your local storage (your computer or flash drive) or cloud storage (Dropbox or CEDAR). There will also be a plethora of search parameters that can be applied to either the feature counts or metadata. When this search is complete it will provide the filtered results in a new table, with nested searches also being available. Once you are satisfied with the filtered results, you can export the results as a CSV file that can be used for further data analysis such as AS2 and Deseq.
Sample downloads and mapping takes place in the Partnership for an Advanced Computing Environment (PACE) provided by the Georgia Institute for Technology. All samples are mapped to PA01 with decoys unstranded, and paired samples are mapped to the first strand. All metadata is scraped directly from NCBI.
Use Case
The overall goal and advantage of using this app is the optimization of data collection and data analysis. This will allow you to dedicate more of your time to your research and the science itself. We’ve put a lot of effort into ensuring this tool is more user-friendly and comprehensive than what’s currently available. Instead of manually sifting through multiple CSV files and mapping individual samples, the PA01 Database allows you to pull together all the relevant feature counts existing across the NCBI database with just a few clicks. This not only saves time but also helps reduce errors and inconsistencies.
There are a multitude of search filters that can be used to find information on samples - whether you’re looking for project information, taxon data, or sample-specific counts. This will hopefully allow you to quickly locate relevant data for your experiments and avoid irrelevant data.
When you’re satisfied with the results of your search queries, you can then export CSV files for both metadata and feature counts to your local or global storage through your file browser. Once these are exported, they will be in the correct formatting for data analysis such as Deseq, AS2 scores, and Sunburst plots.